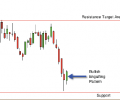
You can see from the most recent candle chart of UDN that the buyers have moved the price off of the support level. The other sign of buying action is found in the length of the shadow beneath the candle from last week. The shadows are the vertical lines that protrude from the top and bottom of each candle. When the shadows are long at the bottom it means that the sellers tried hard to push the price down on those days but the buyers came back with force and rallied the stock back up by the end of the trading day. This week we see a very nice bullish engulfing pattern. The last time this ETF bounced off of this support level, it started off with an engulfing pattern just like we have this week.
