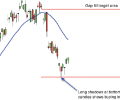
You can see from the most recent candle chart of OIL that the buyers have moved the price off of the support level. The other sign of buying action is found in the length of the shadows beneath the most recent candles. The shadows are the vertical lines that protrude from the top and bottom of each candle. When the shadows are long at the bottom it means that the sellers tried hard to push the price down on those days but the buyers came back with force and rallied the stock back up by the end of the trading day. This is very bullish and we are seeing several days during this week where this has happened. Note the target price that I’ve outlines at the top of the chart.
